Gasoline Market Tightening In Latest EIA Energy Report
 Introduction
After last week`s surprising build of 7.2 million barrels in the oil market, we were wondering if this was an anomaly, the effects of the shipping channel disruptions, or just a timing issue regarding tanker offloads. Well, we added another 7 million barrels to oil inventories again this week, but gasoline inventories had a heavy draw of 7.7 million barrels, thus giving analysts a lot to think about regarding this energy report. If Jeff Currie, head of commodities research at Goldman Sachs is right and we are in a 1 million barrel per day oil deficit, why are we having these outsized builds, especially given the low level of oil imports, not seen in ages? To say there are a lot of cross currents taking place in the oil market is an understatement. Thus, let us not jump to any hasty conclusions, and start examining the data in the weekly EIA oil report.
Crude Oil Stocks
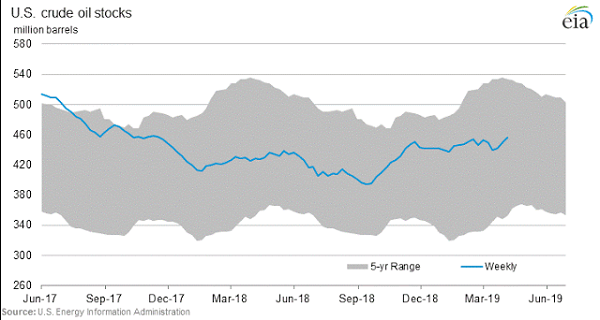
The headline build of 7 million barrels in US oil inventories was mainly concentrated in (PADD 3) along the Gulf Coast moving from 226.8 last week to 232.2 for a build of 5.4 million barrels, and (PADD 5) along the West Coast moving from 48.5 to 50.2 million barrels in storage, for a gain of 1.7 million barrels. The Midwest (PADD 2) overall had a slight draw, mostly due to Cushing moving from 47.1 down to 46.0 as oil was pipelined to the Gulf Coast for refinery use as refineries ramped up run rates to operate at 87.5 percent of their operable capacity, 1.1 percentage points higher than the previous week. The East Coast had a slight draw in oil inventories of 500,000 barrels, and the Rocky Mountain region (PADD 4) had a slight build of 800,000 barrels of oil.
The past week ended on Friday with a relatively solid employment report, but we added another 15 oil rigs in the US, and Rigs are starting to turn back up as the oil price has risen significantly off the $42 bottom in December. And companies seem to want to monetize their opportunities while they can in the oil patch. But these builds point to just how much oil that is being produced right now, any recession coming into the picture hurting the demand side of the equation, could lead to some ridiculously large weekly builds, like in the 20 million range, and the oil market will crash hard again.
Crude Oil Production & Imports
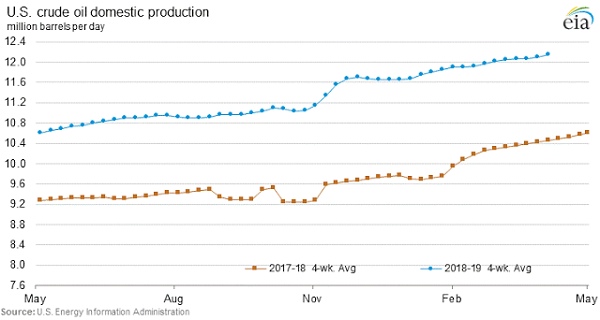
In examining the production number, it came in flat week over week at 12.2 million barrels. However, oil imports came in at 6.6 million barrels, down 164,000 barrels per day from the prior week. Average crude oil imports over the last 4 weeks were 6.7 million barrels per day, 15.5 percent less than during the same period last year. This is where the fact that Saudi Arabia who owns the Motiva refinery in Port Arthur, Texas has stopped shipping in oil to the US market as part of their OPEC cuts. Last year Saudi Arabia was exporting around a 1 million barrels per day to the United States for refining purposes, throw in the Venezuelan sanctions, and we have a very low level of oil imports at 6.6 million barrels. Without the OPEC cuts, and the purposeful strategy of focusing these cuts on the US Market because it is the most transparent market, and gives the Saudi`s the biggest bang for their production cut buck, we would have added another 7 million barrels to this week`s oil inventory build number. Something to think about here, are the Saudi`s just moving that oil committed to the US to China, and thus this is largely becoming a shell game. Thus, less US oil exports needed for China.
Crude Oil Refinery Inputs
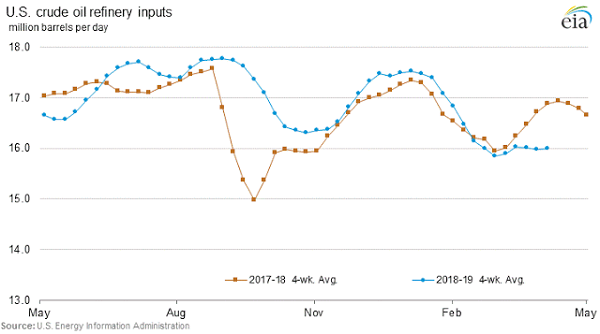
In looking at the Oil Refinery Inputs number, we came in at 16.1, which is significantly better than the 15.85 input number the previous week, but is much lower than a year ago where we printed a 17.02 number for this metric. Some of the reasons for the lower refinery input numbers year over year are due to outages, maintenance, etc. but also some of this lower refinery input number comes down to Saudi Arabia not exporting and refining their own oil here in the US, and other refiners not making up the difference. Therefore, we have these mixed currents in the oil market right now. Saudi Arabia in a sense is holding back the normal refining capacity due to their OPEC cuts strategy, that is playing out in terms of lower overall refinery run rates.
Gasoline Stocks
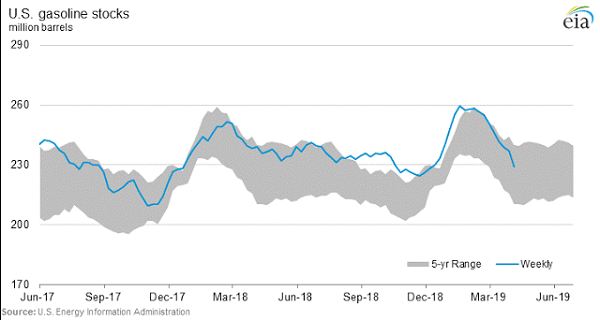
This leads perfectly into the discussion of gasoline stocks which were down a large 7.7 million barrels for the week, much larger than the previous drawdown of 1.8 million barrels the prior week. At 229 million barrels for Total Gasoline Stocks, which represents a 4.1 percent reduction from the level a year ago, we have reduced gasoline inventories by 25 million barrels in 6 weeks. The gasoline market is really starting to tighten as the oil market is starting to build. The normal market response would be to refine more oil into products by ramping of refinery run rates, but it hasn`t happened so far in this recent trend. But at some point over the next few weeks, the oil market will start pricing in a larger crack spread, significant enough to increase refinery run rates. This was the reaction in the energy complex today after the EIA report where the products outperformed the price gains in the oil futures from a percentage’s standpoint. Thus, increasing the crack spread for the products. The real question remains will this incentivize higher run rates over the next several weeks?
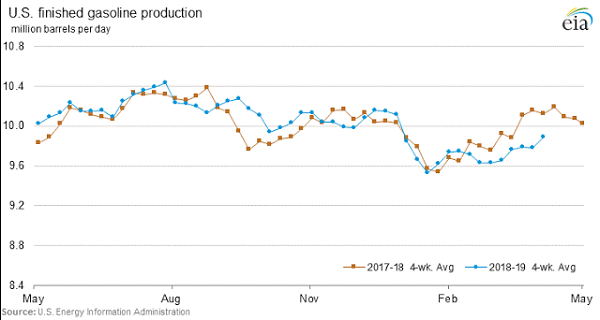
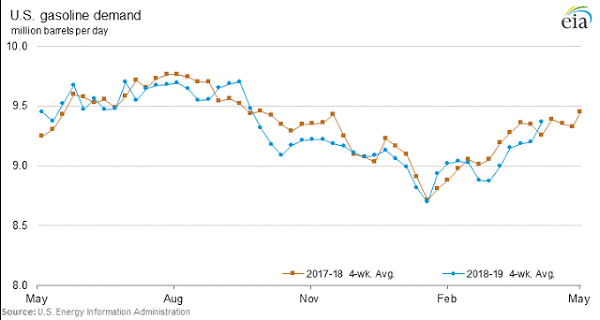
Gasoline Production & Demand
In checking out the Finished Gasoline Production numbers, we came in at 10.17 which is higher than the previous week at 9.81, but basically the same as a year ago at 10.15. We will see if this number jumps the next couple of weeks as the gasoline crack spread rises. The Gasoline Demand number came in at 9.8 million barrels per day versus 9.13 the previous week, and 9.27 a year ago. So quite a jump in the gasoline demand number from last week and a year ago. Maybe as the gasoline market tightens, participants are starting to hoard supplies right now, that is quite a jump. The real question here is whether this is an outlier number, or heads up to what is about to come down the pipeline regarding further tightening in the gasoline market? Some of this might be related to the Venezuelan sanctions.
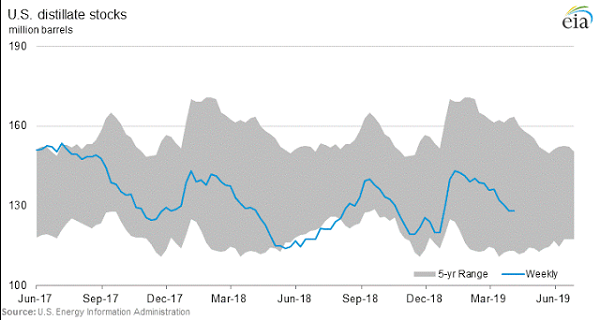
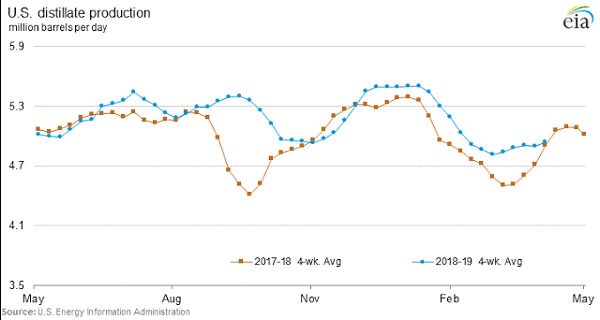
Distillates Stocks, Production & Demand
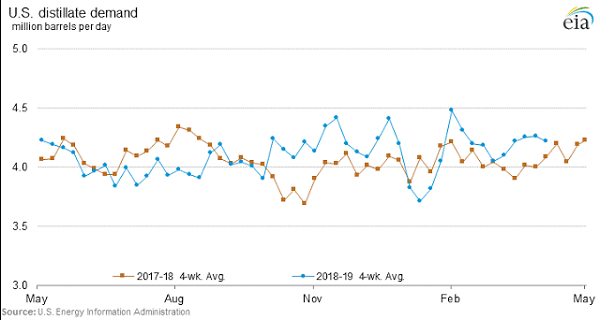
The Total Distillates Stocks number came in flat for the week at 128 million barrels. However, we are closer to the bottom of the five-year averages band than we are to the top of this metric, so there are concerns here as well for this product crack to rise going forward. Today the gasoline crack outperformed the distillates crack as one would expect given the EIA inventory numbers. Total Distillates Production also increased from 4.87 the prior week to 5.04 this week, but unlike gasoline we produced more this time last year at 5.26 for the distillates number. And Distillate Demand came in at 3.78 million barrels per day this week versus 4.16 the previous week, and 4.17 a year ago. Thus, the overall Distillates Stocks number is roughly in line with last year at 0.3 percent below their level last year currently. Consequently, the Gasoline market is tighter than the Distillates market as we speak, and we haven`t seen this in a long time, it is usually the other way around.
Summary
Overall, a very interesting report, and the futures market gave the benefit of the doubt to the oil futures, and rewarded the crack spreads. We will examine in future reports whether this economic feedback loop manifests itself in higher gasoline runs at the refineries, and much higher overall refinery utilization rates to take advantage of higher product spreads versus the oil base input commodity.
Note: This article originally appeared at EconMatters.
Category: Energy


